MuPIT Interactive Instructions
MuPIT interactive is an online tool that allows you to map sequence variants from their genomic position onto protein structures.
Viewing a variant on protein structure can be useful in interpreting its potential biological consequences.
After mapping, the variants are displayed on an interactive 3d structure. The user may turn variants on and off, and display annotations on the protein structure.
Citation
- Niknafs N, Kim D, Kim R, Diekhans M, Ryan M, Stenson PD, Cooper DN, Karchin R. MuPIT Interactive: Webserver for mapping variant positions to annotated, interactive 3D structures Hum Genet. 2013 Nov;132(11):1235-43. doi: 10.1007/s00439-013-1325-0. Epub 2013 Jun 23. PMID: 23793516
- Tokheim C, Bhattacharya R, Niknafs N, Gygax DM, Kim R, Ryan M, Masica DL, Karchin R. Exome-Scale Discovery of Hotspot Mutation Regions in Human Cancer Using 3D Protein Structure. Cancer Res. 2016 Jul 1;76(13):3719-31.
MuPIT Display Overview
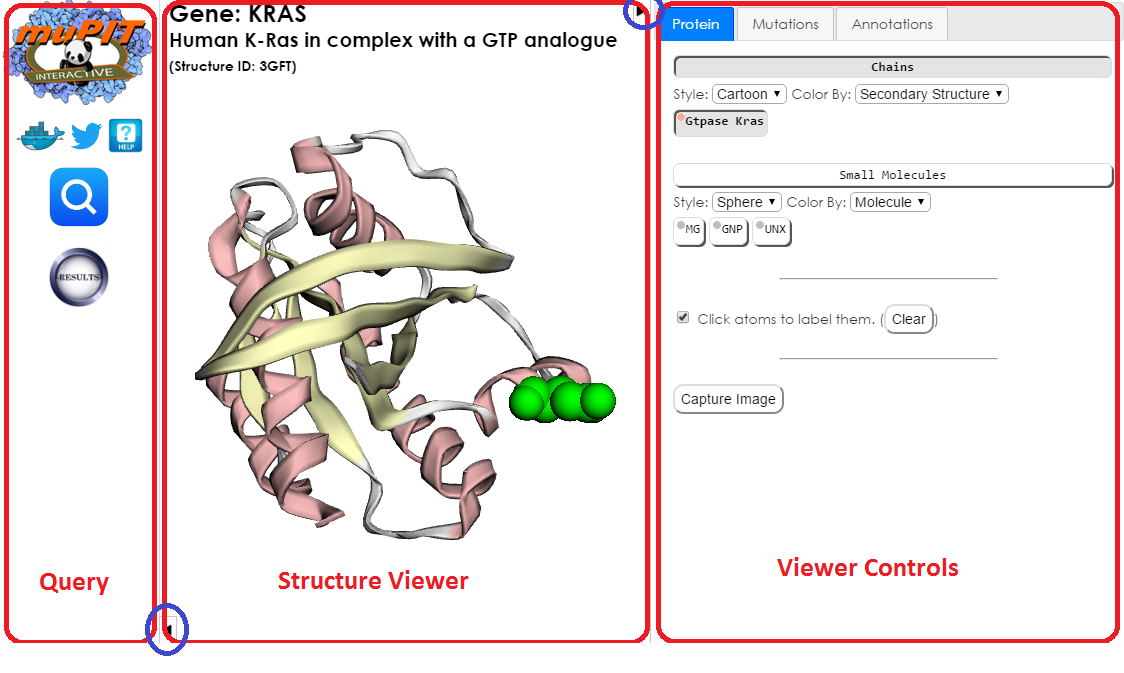
The MuPIT display has three main panels. From left to right, they are:
- Query panel for submitting queries and choosing structures.
- Structure viewer running 3Dmol.js.
- Viewer controls, split into three tabs.
- Protein tab, for changing the display of macro- and small molecules.
- Mutations tab, for highlighting user submitted mutations, TCGA mutations, and TCGA HotMAPS regions.
- Annotations tab, for displaying functional annotations from the UniProt KnowledgeBase.
The following sections describe each panel in detail.
Query Panel: Submitting Queries and Choosing Structures
Submitting a Query
- On the left side of the screen click the query button, shown as a magnifying glass.
- Enter your variants in tabs or space delimited genomic coordinates. For example,
chr7 140753336
chr17 39724004
A mutation position will generate an error if one of the following occurs:- If the position value is non-numeric or missing.
- If the chr value contains extra or erroneous characters.
- Click "Submit" button.
Choosing a Structure from the Query Result
The structures mapped from the user query are available in the results table, which is displayed by clicking on the results button.This displays a table containing the structures that your data mapped to, grouped by gene name. Click on a gene name to expand the structures in this gene. Each structure takes up a row, which shows the structure name, diffraction method and structure ID. Below the structure name is an info line which lists:
- Query positions that map to this structure
- Query positions that fall in a TCGA HotMAPS region
- The number of functional annotations in the UniPROT KnowledgeBase for this structure
- The number of TCGA HotMAPS regions in this structure
Viewing and Resolving Errors
If one or more lines of your input contains an error, a red error button will appear below the results button. Clicking on the error button will bring up the errors table, showing which lines contained an error, and the reason for the error.Common problems include incorrect entry that does not conform to our required format, mutations that do not map onto a protein with a structure in the Protein Data Bank, or mutations with coordinates that we were not able to convert from hg18 with Liftover.
Frequently Asked Questions
Q: Some of my mutations are silent. Can I submit them anyway?A: Sure. However, interpreting your results may not be straightforward. Proceed at your own risk!
Q: How many mutations can I submit at one time?
A: 1000 mutations or less will give you optimum speed. After 2000 however the time taken increases drastically. Because of this, we do not accept submissions of more than 2500 entries.
Q: My results look weird. There are blanks in my results tables. Did something go wrong?
A. Yes! If entries are entered and tables appear blank or only partially filled, there is probably an error in one of your data entries. Measures have been taken to avoid this but if it occurs, the table will most likely populate until the error entry and then stop. Although the table entries will not be in the same order as entered, keeping this in mind should make it easier to find the source of error.
Interacting with the Structure Viewer
This visualization is powered by 3DMol.js. Additional instructions and documentation is available at 3dmol.csb.pitt.edu/doc.
Viewer Controls
| Movement | Mouse Input | Touch Input | ||
|---|---|---|---|---|
| Rotation | Primary Mouse Button | Single touch | ||
| Translation | Middle Mouse Button or Ctrl+Primary | Triple touch | ||
| Zoom | Scroll Wheel or Second Mouse Button or Shift+Primary | Pinch (double touch) | ||
| Slab | Ctrl+Second | Not Available |
Double-clicking on the structure viewer will put the viewer in fullscreen mode. Double-click again, or press esc to exit. Due to browser features fullscreen is only available in Google Chrome, and Microsoft Edge.
Clicking on a part of the structure will display a label containing information on the atom that was clicked. Clicking again will remove the label. More information on labels is available in the Protein tab section.
Advanced users should note that, because 3dMol.js is written in javascript, it may be controlled from the browser console. The documentation is available at 3dmol.csb.pitt.edu/doc. In MuPIT, the structure viewer's $3dMol.GLViewer object is accessed by the global variable v, and the primary $3dMol.GLModel object is accessed by the global variable mainModel.
The default display is a "cartoon" view of the structure, color coded by secondary structure. User submitted mutations appear by default as solid green spheres. A variety of display options may be adjusted in the Protein tab of the controls panel.
Adding Annotations
The Annotations panel allows the user to add, remove, and format mutated residues, hotspots and functional annotations. The panel is organised into three tabs:
- Protein tab
- Mutations tab
- Annotations tab
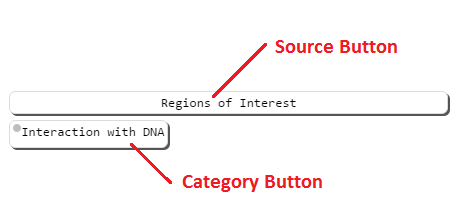
The UI layout of most sources can be seen in the following images.
Overview
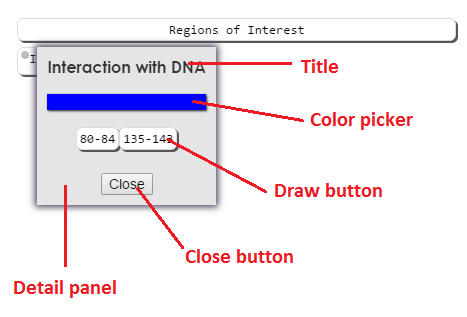
Detail panel
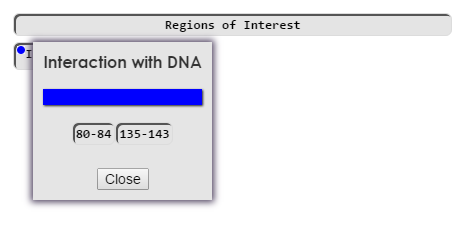
Drawn
Category buttons are listed under source buttons. Right clicking (long pressing on mobile) on a category button will bring up it's detail panel. The detail panel contains additional information about the category, and buttons to draw the annotations associated with that category. Left clicking on draw buttons will draw them to the structure viewer.
Additionally, you may draw/remove all of the annotations in a category by clicking on the category button.
Clicking on a source button will draw/remove all selected annotations from that source from the viewer, but will not change the selection. Clicking on a color picker box will bring up the color picker. This allows you to select a color in the structure viewer for annotations in that category. You may set a color whether annotations are currently drawn of not. Currently drawn annotations will be updated when the color picker is closed. When any annotations in a category are drawn, a color icon will appear on the color button, showing what color the annotation(s) are in the structure viewer.
Protein tab:
You can use this tab to change what parts of the protein structure are displayed and how they are rendered. It has four sections:- chains
- small molecules
- labels
- image capture
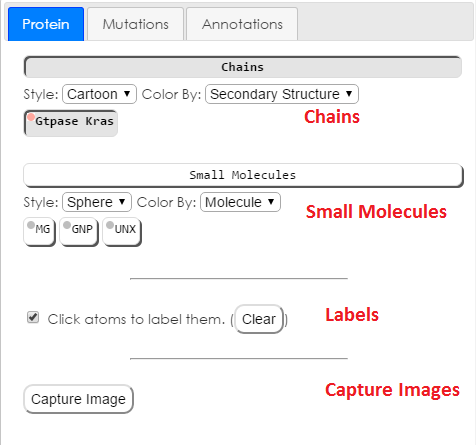
Chains
The Chains section will affect the display of the amino-acid chains in the structure.The drop down menus in the chains section allow you to change the style and color of the protein structure. Available styles are: cartoon, line, sphere (spacefill), stick, and trace. Available color schemes are: secondary structure, chain, style default, and white. Style default will color atoms by element in the line, stick, and sphere styles. Please note that white lines will not show up against the white background of the display.
Small Molecules
The Small Molecules section will affect the display of non-macro molecules in the structure.The drop down menus in the small molecule section allow you to change the style and color of the displayed small molecules. Available styles are: stick, sphere, and line. Available color schemes are: molecule, atom, white, and gray. Please note that single atom small molecules will not appear in stick or line styles.
Please note that water molecules are not included in the small molecule section.
Labels
The labels section has controls for the display of labels. The show labels checkbox will toggle the display of labels, but will not change which atoms are selected for labelling. The clear labels button will delete all labels permanently. Atoms will have to be reselected.Image Capture
The Capture Image button will create a highly detailed rendering of the current state of the structure viewer. Aspect ratio and zoom will be preserved. The image will be rendered at a resolution of 300 dpi on an 11.5 x 8 in letter sized paper. The specific pixel dimensions of this rendering depends on the aspect ratio of the structure viewer.Mutations Tab:
The mutations tab has two sections.- My mutations
- TCGA mutations
My Mutations
The my mutations section displays the user submitted mutations that mapped to this structure. The mutations are categorized by genomic locations, and are shown as green spacefilled residues by default. Genomic locations that map to multiple chains will have a draw button for each chain in the detail panel.TCGA Mutations
Mutations from The Cancer Genome Atlas that appear on this structure are available to be drawn here. They are categorized by tissue type.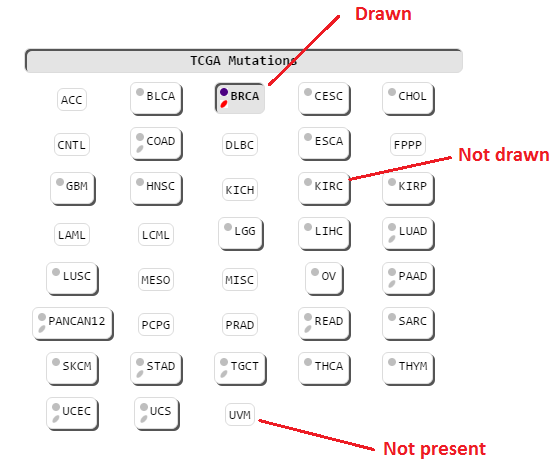
All tissues are shown by default. Tissues which do not have any mutations available for this structure are greyed out and are not clickable.
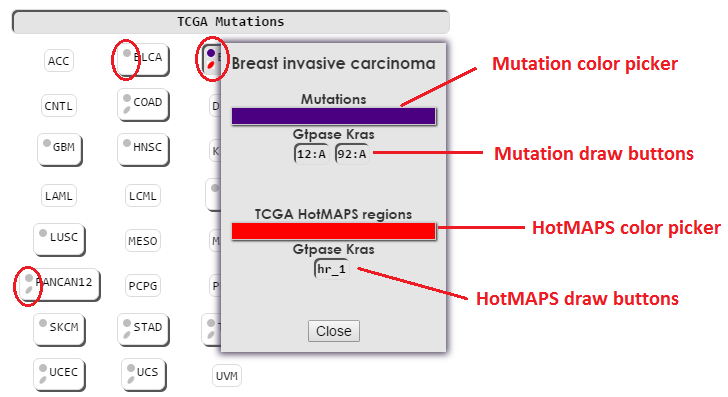
TCGA tissues contain two different types of annotations, mutations and HotMAPS regions.
Mutations can be drawn, colored, and removed similarly to the mutations in the My Mutations section. Any overlapping mutations will be drawn with the color of the mutation category last drawn. My Mutations will always override the color of TCGA mutations. Use the source buttons for My Mutations and TCGA Mutations to check for overlapping mutations.
HotMAPS regions can be drawn, colored and removed separately from TCGA mutations. Additionally, TCGA category buttons have a second color icon to indicate whether HotMAPS regions are drawn. If no HotMAPS regions are available for a tissue, no HotMAPS color icon will be displayed. This can be seen above by comparing BLCA to PANCAN.
Clicking on a TCGA category (tissue) button will draw/remove both the mutations and HotMAPS from the structure viewer.
Annotations Tab
The annotations tab displays functional annotations from the UniPROT Knowledge Base. In this tab, source buttons contain annotation types, and category buttons contain specific annotations. If a functional annotation is composed of multiple chains of residues, those will be shown separately in the detail panel.An explanation of the available functional annotations can be found here.
Link to MuPIT Interactive
It is possible to link to MuPIT with a URL, to see genomic location(s)-to-3D structure and gene-to-3D structure mappings without submitting a query, as explained below.
Single Genomic Location to 3D Structures Mapping
URL: http://mupit.icm.jhu.edu/MuPIT_Interactive?gm=chrom:position
chrom is chromosome (e.g. "chr17") and position is a position (e.g. "39724004").
Example: http://mupit.icm.jhu.edu/MuPIT_Interactive?gm=chr17:39724004
chrom is chromosome (e.g. "chr17") and position is a position (e.g. "39724004").
Example: http://mupit.icm.jhu.edu/MuPIT_Interactive?gm=chr17:39724004
Multiple Genomic Locations to 3D Structures Mapping
URL: http://mupit.icm.jhu.edu/MuPIT_Interactive?gm=chrom:position,chrom:position,...
chrom is chromosome (e.g. "chr17") and position is a position (e.g. "39724004"). Multiple genomic locations of chrom:position format are concatenated with a comma.
Example: /MuPIT_Interactive/?gm=chr17:39724004,chr17:39724001
chrom is chromosome (e.g. "chr17") and position is a position (e.g. "39724004"). Multiple genomic locations of chrom:position format are concatenated with a comma.
Example: /MuPIT_Interactive/?gm=chr17:39724004,chr17:39724001
Gene to 3D Structures Mapping
URL: http://mupit.icm.jhu.edu/MuPIT_Interactive?gene=hugo
hugo is a gene HUGO symbol (e.g. "BRCA1").
Example: http://mupit.icm.jhu.edu/MuPIT_Interactive?gene=BRCA1
hugo is a gene HUGO symbol (e.g. "BRCA1").
Example: http://mupit.icm.jhu.edu/MuPIT_Interactive?gene=BRCA1
Direct Viewing of a 3D Structure
URL: http://mupit.icm.jhu.edu/MuPIT_Interactive?structure_id=SID
SID is the ID of a structure (e.g. PDB ID, or NP_ or ENSP_ accession ID followed by "_" and a number which starts with 1).
Example: http://mupit.icm.jhu.edu/MuPIT_Interactive/?structure_id=4l18
SID is the ID of a structure (e.g. PDB ID, or NP_ or ENSP_ accession ID followed by "_" and a number which starts with 1).
Example: http://mupit.icm.jhu.edu/MuPIT_Interactive/?structure_id=4l18
Direct Viewing of a UniProt Position
URL: http://mupit.icm.jhu.edu/MuPIT_Interactive?pos=UniProt Pos&protquery=y
SID is the ID of a structure (e.g. PDB ID, or NP_ or ENSP_ accession ID followed by "_" and a number which starts with 1).
Example: /MuPIT_Interactive/?gm=Q969V6:25&protquery=y
SID is the ID of a structure (e.g. PDB ID, or NP_ or ENSP_ accession ID followed by "_" and a number which starts with 1).
Example: /MuPIT_Interactive/?gm=Q969V6:25&protquery=y
Checking the Mapping of a Genomic Position to a 3D Structure
URL: http://mupit.icm.jhu.edu/MuPIT_Interactive/rest/showstructure/check?pos=chrom position
chrom is chromosome (e.g. "chr7") and position is a position (e.g. "140753336").
Example: http://mupit.icm.jhu.edu/MuPIT_Interactive/rest/showstructure/check?pos=chr7 140753336
chrom is chromosome (e.g. "chr7") and position is a position (e.g. "140753336").
Example: http://mupit.icm.jhu.edu/MuPIT_Interactive/rest/showstructure/check?pos=chr7 140753336
Checking the Mapping of a Gene to a 3D Structure
URL: http://mupit.icm.jhu.edu/MuPIT_Interactive/rest/showstructure/check?gene=gene
hugo is a gene HUGO symbol (e.g. "TP53").
Example: http://mupit.icm.jhu.edu/MuPIT_Interactive/rest/showstructure/check?gene=tp53
hugo is a gene HUGO symbol (e.g. "TP53").
Example: http://mupit.icm.jhu.edu/MuPIT_Interactive/rest/showstructure/check?gene=tp53
Checking the Mapping of a Protein to a 3D Structure
URL: http://mupit.icm.jhu.edu/MuPIT_Interactive/rest/showstructure/check?pos=UniProt Pos&protquery=y
UniProt is a UniProt protein sequence accession number (e.g. A0A087WTH1).
Pos is a amino acid position in the UniProt protein sequence.
Example: http://mupit.icm.jhu.edu/MuPIT_Interactive/rest/showstructure/check?pos=Q969V6 10&protquery=y
UniProt is a UniProt protein sequence accession number (e.g. A0A087WTH1).
Pos is a amino acid position in the UniProt protein sequence.
Example: http://mupit.icm.jhu.edu/MuPIT_Interactive/rest/showstructure/check?pos=Q969V6 10&protquery=y